

The Countdown is On: 470 Days
The Countdown is On: 470 Days
I'm going to show you how to create a GA4 Landing Pages report.

Welcome to Edition No. 8 of my weekly digital strategy newsletter, providing practical analysis of the latest in the world of content creation.
Please consider supporting my work in any of the following ways:
Become a member. (The entire newsletter is free for a limited time.)
Forward this to a friend or colleague and encourage them to subscribe.
Share this post on social media.
For the best reading experience, go to the website.
Contents
I. News: GAU Finally Has a Death Date
II. Analysis: GA4: There’s Plenty of Time To Prepare
III. Tip: Hacking a Landing Page Report in GA4
News
GAU TO GA4: GOOGLE SETS A HARD DEADLINE
It’s been more than two years in the making, but Google has finally announced a hard transition date from Universal Analytics to GA4:
July 1, 2023: Standard GAU accounts will stop processing data
The existing stored data will continue to be accessible for “at least six months,” though (I imagine) unlikely much longer
October 1, 2023: GAU 360 accounts will stop processing data
The real news here is that we have a date for what we already knew was coming.
More analysis below.
FACEBOOK JOINS TIKTOK
You can now follow Facebook on TikTok.
A company spokesperson in TechCrunch:
Brands leverage a variety of channels, including some of our social media platforms, to reach and engage with the people using their products and services every day.
This isn’t unusual. Instagram, for example – owned by the same parent company, Meta – frequently utilizes Twitter (as do many other social media platforms) to announce product updates.
And TikTok, of course, has an Instagram account.
So while this is noteworthy news, it’s also not that big of a deal.
As of the writing of this post, Facebook has yet to post to TikTok, and has more than 26,000 followers.
INFLATED iOS 15 EMAIL OPEN RATES
Apple’s Mail Privacy Protection, released in Sept. 2021, is inflating email open rates for iOS 15 users, according to a Campaign Monitor study.
UPDATES & TESTS


This allows you to have someone off-camera keeping everything running smoothly so that anyone on-camera can focus on the Live instead of logistics.
TikTok
Desktop uploads are here. Click the cloud symbol with the upward-pointing arrow near the top right and you’ll be brought to this page, where you can also schedule posts ahead of time:

“…all users can download and share published Idea Pins on social channels including Facebook and Instagram. These Idea Pins will be downloaded as a watermarked video…”
What are Idea Pins? “Idea Pins are a multi-page canvas to share unique ideas, tutorials, passions with others.”
It took Twitter just four days to roll back a timeline tweak. This allows you to choose to have your feed appear in reverse-chronological order by default, instead of based on the algorithm.
The blue bird also appears to be working on “Tweet Awards,” apparently a way to “tip” other users aka another revenue source for creators.
Analysis: GA4: There’s Plenty of Time To Prepare
(Continued from above…)
Why should you set up GA4 if you haven’t already done so? The primary reason is that data won’t carry over from GAU, which means, for example, that if you’re not set up by July 1 of this year, you won’t have any year-over-year data to analyze when GAU is shut off.
Overall reaction to the announcement has been fairly negative. This reply to GA’s LinkedIn post encapsulates the general concern:

If you use the platform on a regular basis, you’ll have noticed that it’s buggy. Features are frequently changed, renamed or removed altogether. (Isn’t that, however, what a beta version is for?)
Another challenge is that it’s vastly different than GAU. “Landing Pages,” for example, is a great built-in acquisition report in Universal Analytics that doesn’t exist in GA4. (But I show you a workaround in this week’s tip, below.)
And it’s not just that the report doesn’t exist – “landing page” isn’t even a data point. You have to match the Page Location and Session Start events to get the same information.
The basic built-in reports give a decent enough overview of your audience and their behavior, but if you want to get your hands dirty – in Exploration – GA4 is much more complicated.
Now, let’s look at the bright side.
GA4, in its raw, mercurial self, has been available to play with for well over a year. Although it certainly hasn’t been capable of being anyone’s primary analytics platform, nothing has stopped us from experimenting and getting accustomed to the changes.
Second, 15 months is a long time. For two reasons.
A. If you haven’t yet started using GA4, you can continue with GAU while mastering its successor without any pressure.
B. We’re talking about Google. I don’t think they would have announced a hard transition date if they didn’t think the platform would be ready in time.
I’m going to share some really obvious advice: The best way to get started once your set up is to play with the platform.
Visit the Home dashboard every day. Look at the built-in reports. Set up custom reports in Explore.
If you start utilizing GA4 today in parallel with GAU, in 15 months, you’ll be more than prepared. And hopefully the new version is so well-refined by then that we won’t even miss it.
What is your favorite GA4 feature? Your biggest gripe? Let me know below in the comments.
Weekly Tip
What a Search User Likes on Your Site
Do you have a website? Do you know whether your organic search referrals are satisfied with what they find there?
I’m going to show you how to leverage Google Analytics 4 to answer that question. Essentially, a Landing Pages report, which is available by default in Universal Analytics but not at all in GA4.
(This is not about how well you’re attracting search traffic. This tip is about the user behavior in the case that they do come to your site via organic search.)
Assuming you have GA4 set up and are already collecting data, here’s what you need to do:
Go to the Explore tab on the left menu bar.

Choose the “Blank” template to begin a new exploration.

Choose the following report settings:
Rows
Page title
AND/OR**page path + query string
Default channel grouping
Columns
Event name
Values
Event count
Active users
Average engagement time per session
AND/OR**Engaged sessions
Filters
Event name exactly matches “session_start”
Default channel grouping exactly matches “Organic Search”
Your dashboard should then look something like the following screenshot. I used the GA4 demo account to create this example, so excuse the weird and limited data.
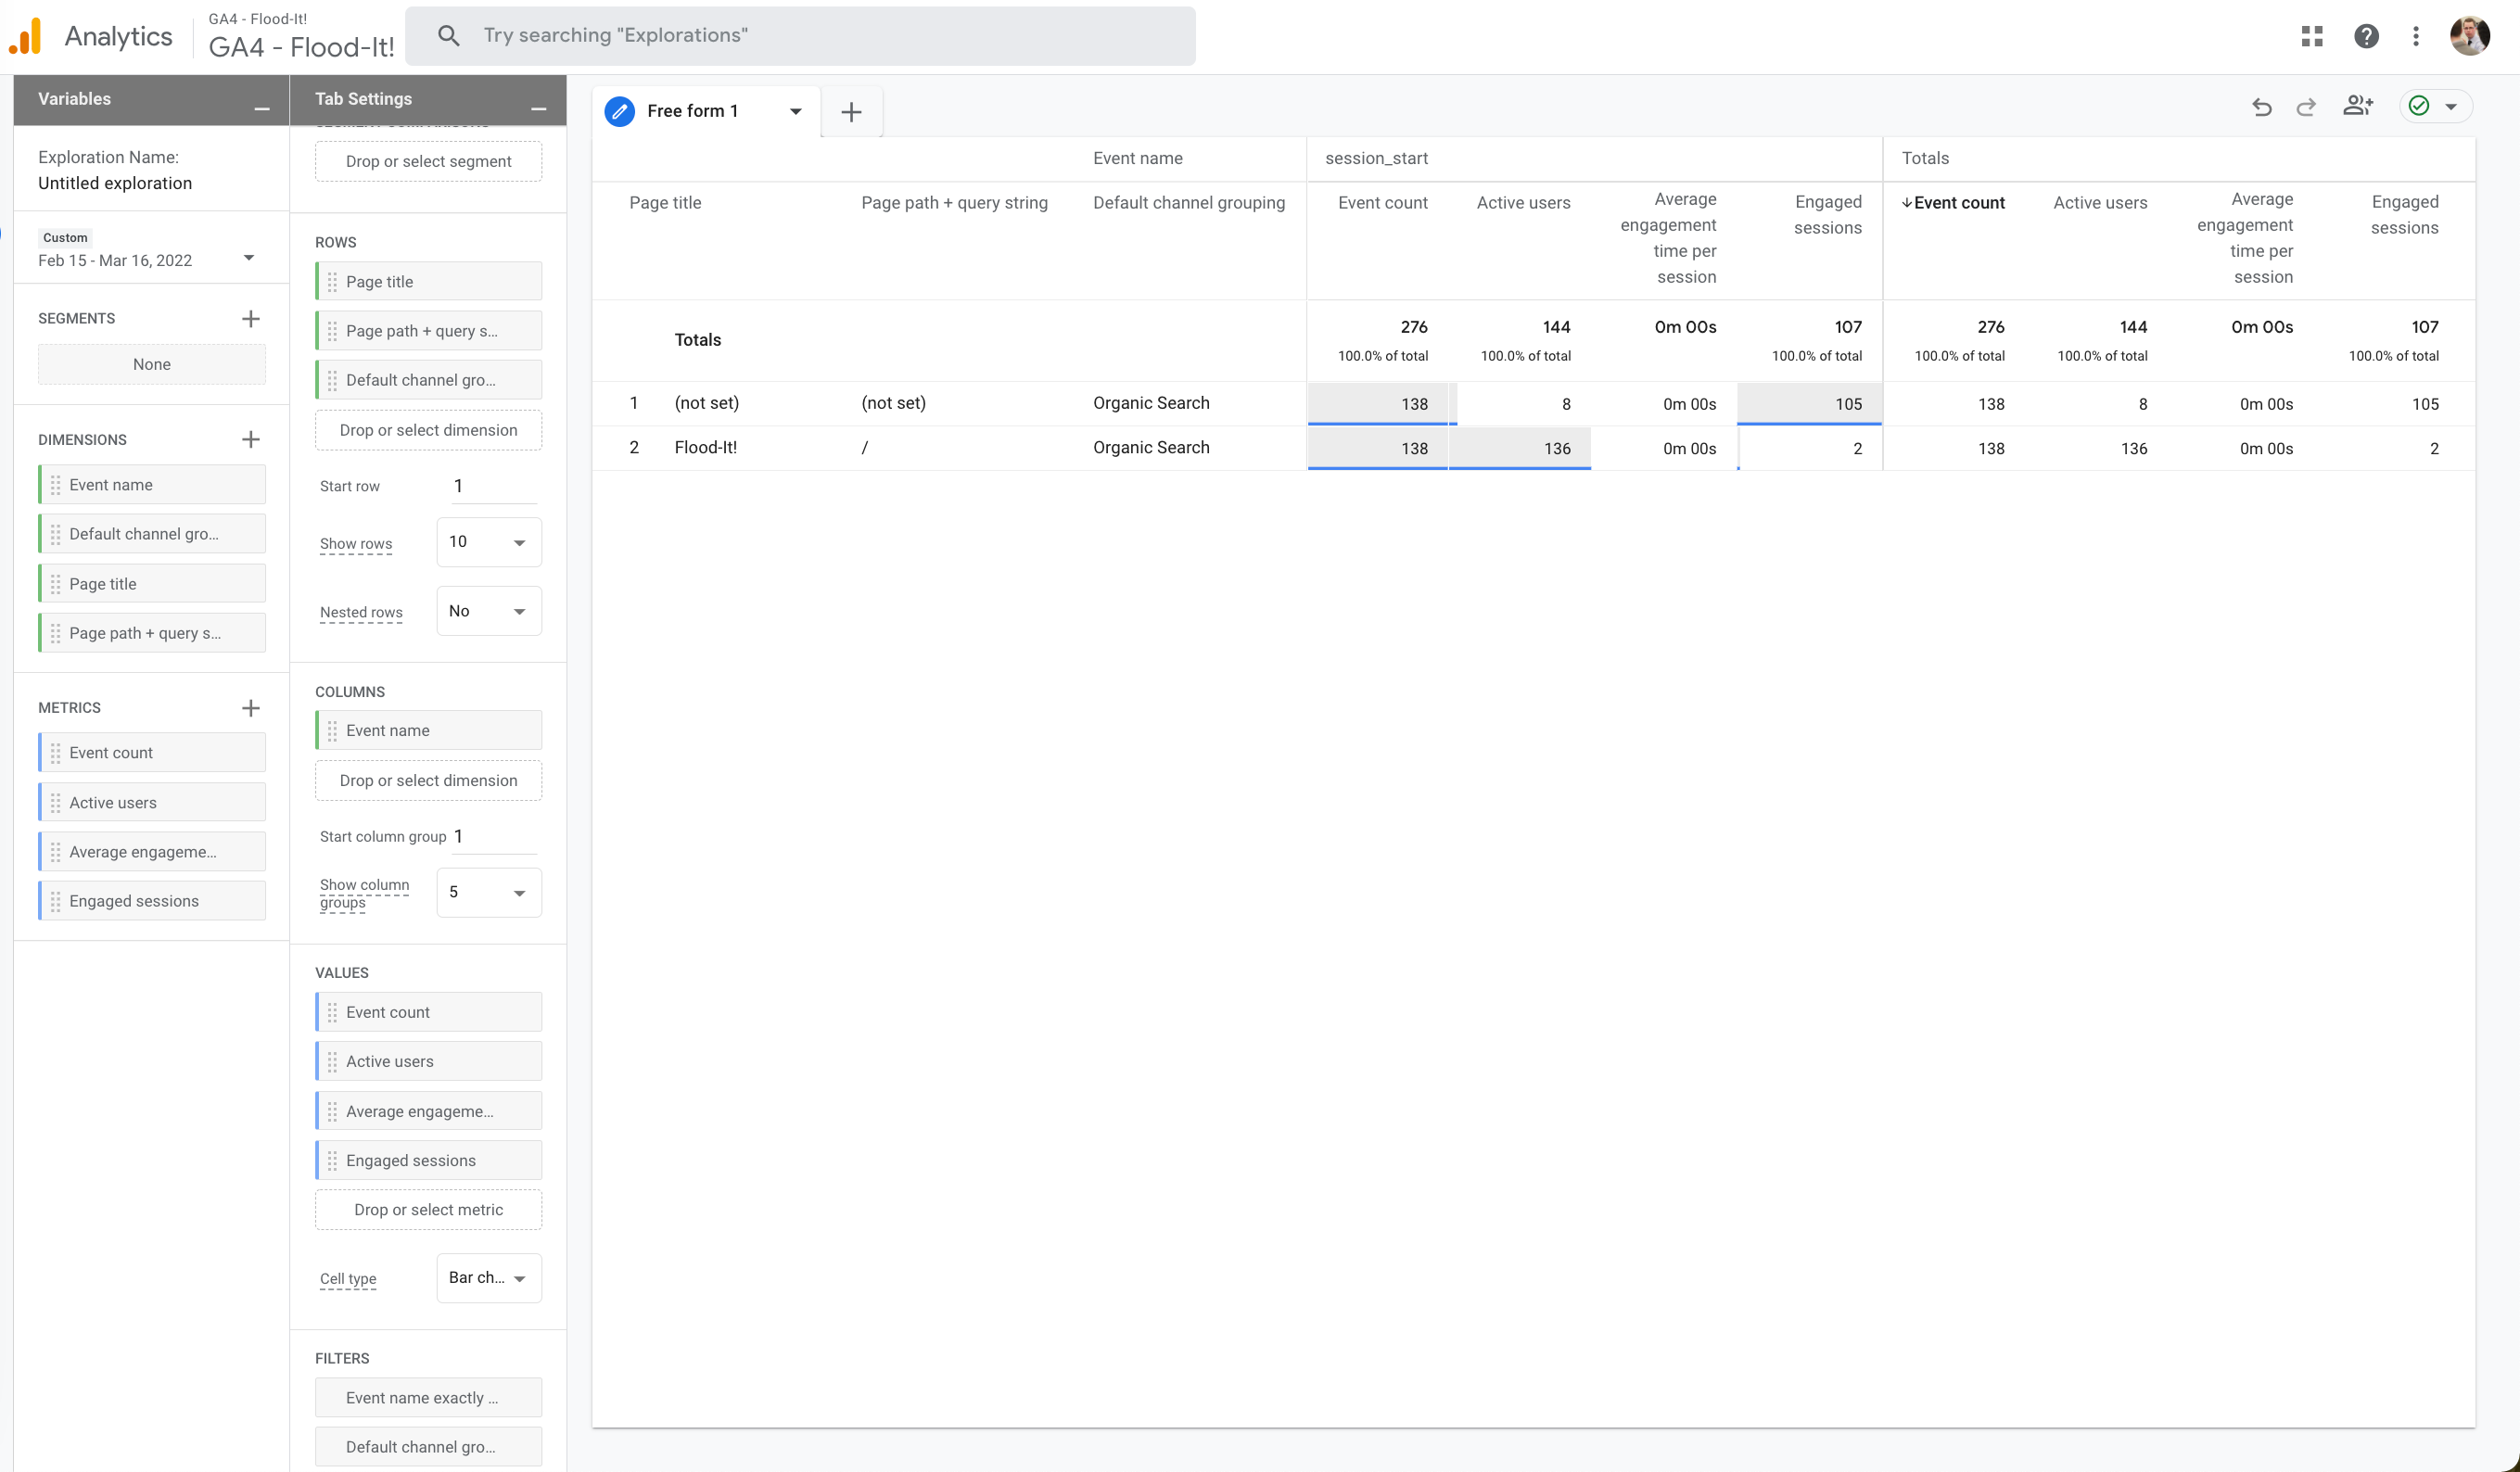
What’s going on in this report? First, Google’s definitions for the variables we chose:
Page title: The page title that you set on your website
Page path + query string: These are the parts of the URL that come after the domain
Default channel grouping: Channel groupings are rule-based definitions of your website's traffic sources
Event name: The name of the triggered event
Active users: The total number of active users
Average engagement time per session: User engagement duration per session
Engaged sessions: The number of sessions that lasted longer than 10 seconds, or had a conversion event, or had 2 or more screen or page views
Since we filtered “Event name” by “Session start,” we have essentially created a GAU-like landing pages report.
Our other filter shows us traffic that came only from organic search. This could be Google, Bing or another non-paid source.
So our report data is narrowed to 1) the first page seen by 2) users who came to the site via an organic search source. In other words, they clicked on a link on a SERP that brought them to that specific page on your site.
Next we have the page title, which is basically your h1 tag, and the page path + query string, which is everything that comes after .com (or .net or whatever) in a given URL. (In GAU this is simply called “page path.”) This tells us the specific landing page. Either by name or by URL. It’s two ways of looking at the same thing.
Event count tells us how many times someone landed on each of these pages, and active users tells us the number of different users.
Lastly, we have engagement time per session and engaged sessions, respectively. And this, my friends, is what will tell us whether a user probably/actually got something out of their visit to your site.
In GAU, we have bounce rate. That has roughly been replaced by engaged sessions. Whereas a high bounce rate was a bad thing, a high number of engaged sessions is a good thing. A fun manual calculation would be engaged sessions/session starts to get an engaged sessions %. (Manual calculation because you won’t find that stat in Google.)
Again, the higher the better. So if a particular landing page via organic search has a high engaged sessions %, that means users are probably finding what they’re looking for via search. A low one means they’re clicking through and either finding what they sought in a hurry, or not at all, and aren’t enticed to continue browsing your site.
Similarly, the higher the engagement time per session, the better. What’s a good engagement time per session? The best way to figure this out would be to track over time as well as compare to other referral sources beside organic search. This will vary across websites and industries, though higher is always better1.
Despite the density of this tip, we’re just scratching the surface. But I hope it gives you some insight into GA4 reports as well as some of the differences from GAU.
Did you find this post useful? Please share it to help spread the word!
One example of a possible exception would be for websites that have transactions take place on third-party sites. Even then, high engagement time per session + an off-site purchase is even better than low time + purchase.